Bilingual Town Names
It seems that we Belgians just love confusing foreigners…
Imagine wanting to take a train to Mons from Ghent but there only is one driving to Bergen. Or driving south with a GPS telling you to follow the direcion of Liège, but for a while you will only see signs to Luik.
Mons/Bergen, Liège/Luik, Ypres/Ieper… those names refer to exactly the same city - one of them is the official French name, the other one the official Dutch one.
Two week ago, I heard again a story from foreigners who got very confused, and I realized I have no idea how many towns/cities we have like this. Sounds like a perfect time to play around with tmap and leaflet!
Data source
I found everything I needed on this website from the Belgian government.
But before importing the data, there are some packages needed along the way:
#packages for the data exploration
library(dplyr)
library(stringr)
library(readr)
library(ggplot2)
#packages for the maps
library(sp)
library(tmap)
library(viridisLite)
library(leaflet)
library(BelgiumMaps.StatBel)Importing the data. In the original repo everything was set up in Excel but ReadXL wasn’t playing nicely together with blogdown, so turned it into csv. Readr on the other hand didn’t play nice with the special characters (é, è, ü etc) but that was slightly easier to fix by adding an ´Encoding() call.
#Importing the data
raw_data <- read_csv("https://github.com/suzanbaert/BilingualTowns/blob/master/2017-12%20TF_SOC_POP_STRUCT_2017_tcm325-283761.csv?raw=true")
#Fixing the special characters after read_csv
Encoding (raw_data$TX_MUNTY_DESCR_NL) <- "latinl"
Encoding (raw_data$TX_MUNTY_DESCR_FR) <- "latinl"Cleaning the data
The data contained a lot of unneeded administrative data, and I wanted to rename some columns to English.
#Keeping only the variables needed
data <- raw_data %>%
select(contains("MUNTY"), TX_RGN_DESCR_NL, CD_SEX, TX_NATLTY_NL, TX_CIV_STS_NL, CD_AGE, MS_POPULATION)
colnames(data) <- c("REFNIS", "TownNL", "TownFR", "Region", "Sex", "Nationality", "MaritalStatus", "Age", "Population")
#Translating Region names to English
data$Region <- data$Region %>%
str_replace("Vlaams Gewest", "Flanders") %>%
str_replace("Waals Gewest", "Wallonia") %>%
str_replace("Brussels Hoofdstedelijk Gewest", "Brussels agglomeration")Additionally, the data does not have a total population count, but is divided in demographic subsets. If I ever wanted to know how many people there are with exactly the same demographics as me (town, age, gender, marital status) I can now find out (26 by the way).
But since that’s not really what I’m after, I used dplyr to create a summary population table, and immediately added a new boolean column to compare Town Names in Flemish and French.
#Creating a dataframe with total population for each town,
#and adding a column to see whether they have the same name
popdata1 <- data %>%
group_by(TownNL, TownFR, Region, REFNIS) %>%
summarise(population=sum(Population)) %>%
arrange(desc(population)) %>%
mutate(SameName = TownNL==TownFR) %>%
ungroup()Quite quickly an issue presented itself: while browsing through some breakouts, I noticed that some town names are annotated with their district. Beveren for instance is called the same in Flemish or French, but its district got translated, so it got flagged as a town with a different name in Flemish or French.
#Noticing an issue:
popdata1%>%
filter(Region=="Flanders") %>%
filter(!SameName) %>%
slice (11:13)## # A tibble: 3 x 6
## TownNL TownFR Region REFNIS popu~ Same~
## <chr> <chr> <chr> <int> <int> <lgl>
## 1 Beveren (Sint-Niklaas) Beveren (Saint-Nicolas) Fland~ 46003 47946 F
## 2 Dendermonde Termonde Fland~ 42006 45583 F
## 3 Vilvoorde Vilvorde Fland~ 23088 43653 FTo get rid of the districts, I cleaned out any word pattern between brackets, and re-generated a boolean column DiffName to see whether the town names are different.
#Removing the sectors between brackets
popdata <- popdata1
popdata$TownNL <- str_replace(popdata$TownNL, pattern="\\s\\(.+\\)", replacement="")
popdata$TownFR <- str_replace(popdata$TownFR, pattern="\\s\\(.+\\)", replacement="")
#Reassessing whether the names are the same
popdata <- popdata %>%
mutate(DiffName = TownNL != TownFR) %>%
select(TownNL, TownFR, DiffName, population, Region, REFNIS)A tiny glimpse of the data
There are 95 towns/cities with two different official names, which is 16% of the total amount of towns. Contrary to what some people might assume, it’s more or less similar in both regions: 13% of Flemish towns have an official French name, 16% of Walloon towns have an official Flemish name on top. Only Brussels, an official bilingual region, has a much higher percentage of ‘double names’.
#How many have exactly the same name?
#by region
popdata %>%
group_by(Region) %>%
summarise(NTowns=n(), N_DiffName=sum(DiffName),
Prop_SameName =1-round(mean(DiffName),2), Prop_DiffName=round(mean(DiffName),2))## # A tibble: 3 x 5
## Region NTowns N_DiffName Prop_SameName Prop_DiffName
## <chr> <int> <int> <dbl> <dbl>
## 1 Brussels agglomeration 19 13 0.320 0.680
## 2 Flanders 308 39 0.870 0.130
## 3 Wallonia 262 43 0.840 0.160Mapping the towns with two official names
Using tmap I created two first maps: the first one shows the general regions in Belgium, and a second one highlighting just the towns that have two official town names.
#Importing SPdataframe for Belgium
data("BE_ADMIN_MUNTY", package="BelgiumMaps.StatBel")
#creating a Region2 for making the second plot highlighting only DiffName towns
popdatamap <- popdata %>%
mutate(Region2 = ifelse(DiffName==TRUE, Region, NA))
#Merging my 2017 data with the SPdataframe
mapdata <- merge(BE_ADMIN_MUNTY, popdatamap, by.x = "CD_MUNTY_REFNIS", by.y = "REFNIS")
#Plot different regions
virpalette <- rev(viridis(3))
regionplot<- tm_shape(mapdata) +
tm_fill(col="Region", palette=virpalette,
title = "Regions in Belgium")+
tm_polygons()+
tm_layout(legend.position = c("left", "bottom"))
#Plot to show those with different name by region
nameplot <- tm_shape(mapdata) +
tm_fill(col="Region2", palette=virpalette,
colorNA = "gray90", textNA="Same name",
title = "Towns with two official names")+
tm_polygons()+
tm_layout(legend.position = c("left", "bottom"))
#Show both plots next to each other
tmap_arrange(regionplot, nameplot)First of all, for people not familair with Belgium: you see our basic regions in the left plot
- The yellow dot in the middle is the Brussels agglomeration, officially bilingual
- The north in green is Flanders where the official language is Dutch (of Flemish as we call it)
- The south in purple is Wallonia where the official language is French
- The divide between green en purple is called the language border…
- To make things even more complicated, some towns in Flanders or Wallonia have a special status: they have “language facilities”. To make something complicated very simple: they are sort of bilingual without being bilingual.
The image on the right just shows all the towns with two official town names. Seeing a higher concentration of these towns around the language border is not a complete surprise, but it does not explain the majority of towns.

Distilling the reason for two official town names
Reason 1: Brussels, an official Bilingual region
In the above table it was obvious that the Brussels region has a much higher share of towns with two offical names: 68% versus the country average of 16%. Given Brussels status as bilingual that should not come as a surprise. I was actually more surprised to realize that there are still 6 that only have their original name: Anderlecht, Jette, Etterbeek, Evere, Ganshoren and Koekelberg.
#Checking the data on Brussels
popdata %>%
filter(Region=="Brussels agglomeration") %>%
summarise(NTowns=n(), N_SameName=n()-sum(DiffName), N_DiffName=sum(DiffName),
Prop_SameName =1-round(mean(DiffName),2), Prop_DiffName=round(mean(DiffName),2))## # A tibble: 1 x 5
## NTowns N_SameName N_DiffName Prop_SameName Prop_DiffName
## <int> <int> <int> <dbl> <dbl>
## 1 19 6 13 0.320 0.680#Adding a column to note down the reason for different names
reason_BXL <- popdata %>%
filter(Region=="Brussels agglomeration") %>%
filter(DiffName) %>%
mutate(Reason = "Brussels")
popdata%>%
filter(Region=="Brussels agglomeration") %>%
filter(DiffName) %>%
arrange(desc(population))%>%
select(-Region, -REFNIS) %>%
knitr::kable()| TownNL | TownFR | DiffName | population |
|---|---|---|---|
| Brussel | Bruxelles | TRUE | 176545 |
| Schaarbeek | Schaerbeek | TRUE | 133042 |
| Sint-Jans-Molenbeek | Molenbeek-Saint-Jean | TRUE | 96629 |
| Elsene | Ixelles | TRUE | 86244 |
| Ukkel | Uccle | TRUE | 82307 |
| Vorst | Forest | TRUE | 55746 |
| Sint-Lambrechts-Woluwe | Woluwe-Saint-Lambert | TRUE | 55216 |
| Sint-Gillis | Saint-Gilles | TRUE | 50471 |
| Sint-Pieters-Woluwe | Woluwe-Saint-Pierre | TRUE | 41217 |
| Oudergem | Auderghem | TRUE | 33313 |
| Sint-Joost-ten-Node | Saint-Josse-ten-Noode | TRUE | 27115 |
| Watermaal-Bosvoorde | Watermael-Boitsfort | TRUE | 24871 |
| Sint-Agatha-Berchem | Berchem-Sainte-Agathe | TRUE | 24701 |
Reason 2: Larger cities
Cities are generally more important and I would have guessed that most of our cities have two official names. By just looking at the difference in average population between towns that have two names (DiffName==TRUE) and those who don’t, there clearly is a skew towards higher population town.
A quick plot in ggplot confirms this to be true: grey shows all the towns in Belgium according to their population size on a logarithmic scale. I coloured those who have two names in green.
popdata %>%
group_by(DiffName) %>%
summarise(mean=mean(population), median=median(population))## # A tibble: 2 x 3
## DiffName mean median
## <lgl> <dbl> <dbl>
## 1 F 14744 11383
## 2 T 42511 24701#Plotting average town size of small and larger towns
ggplot()+
geom_histogram(data=popdata, aes(x=population), fill="grey", alpha=0.6)+
geom_histogram(data=subset(popdata, DiffName==TRUE), aes(x=population), fill="cadetblue4", alpha=1)+
scale_x_log10()+
labs(x= "Population", y="Number of towns", title="Size of towns with two official names amongst all towns in Belgium")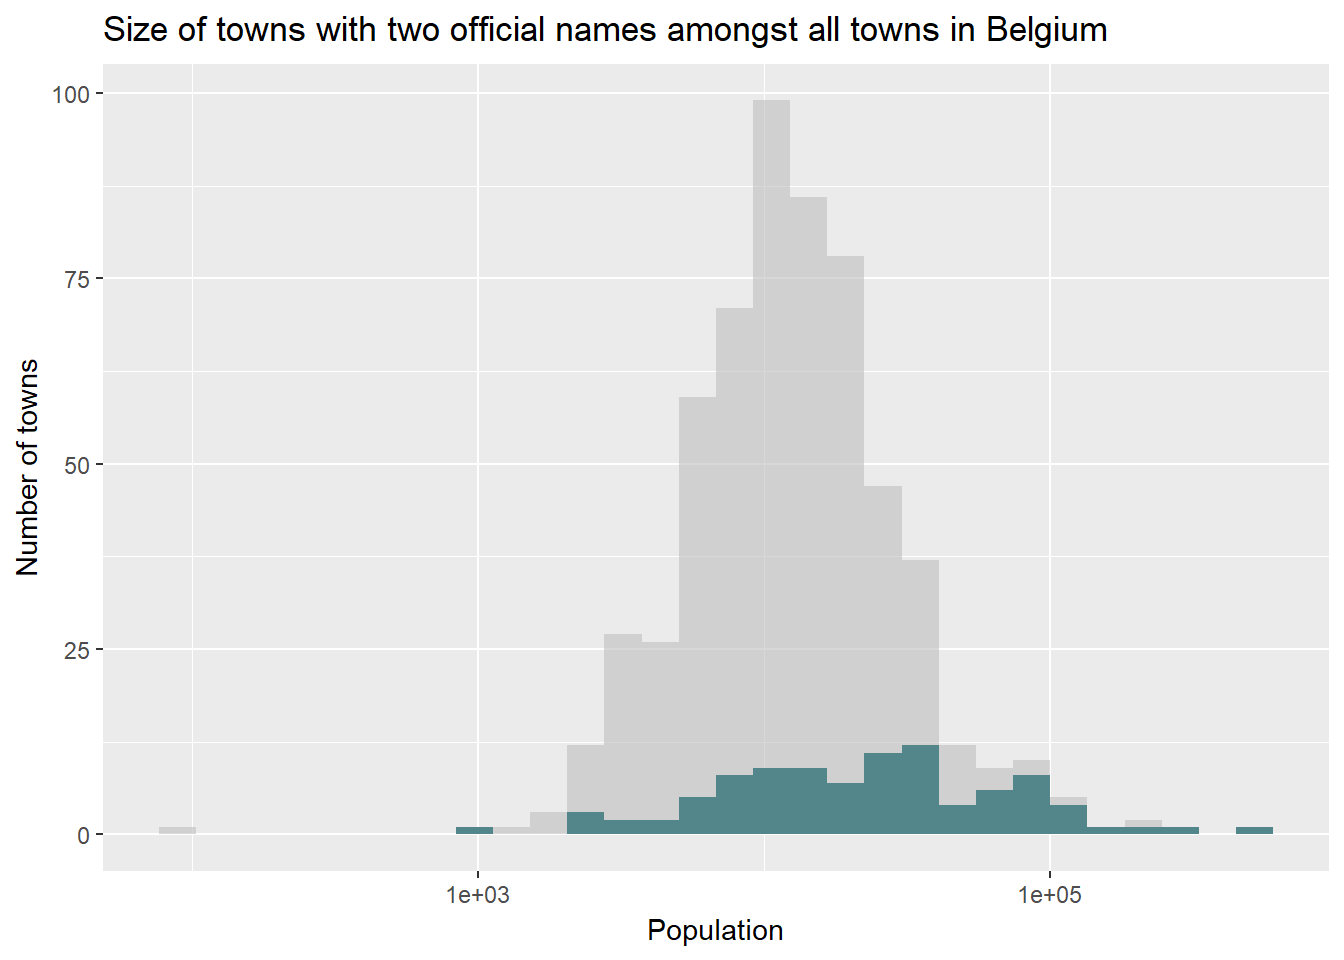
I took a shortcut to define our cities: the 10% highest populated towns. I got the cutoff value via quantile(popdata$population, probs=0.9): 34190.
#Proportion of Cities with different names
popdata %>%
filter(population > 34000) %>%
summarise(NTowns=n(), N_SameName=n()-sum(DiffName), N_DiffName=sum(DiffName),
Prop_SameName =1-round(mean(DiffName),2), Prop_DiffName=round(mean(DiffName),2))## # A tibble: 1 x 5
## NTowns N_SameName N_DiffName Prop_SameName Prop_DiffName
## <int> <int> <int> <dbl> <dbl>
## 1 60 27 33 0.450 0.550#Adding a reason column
reason_city <- popdata %>%
filter(population > 34000) %>%
filter(Region != "Brussels agglomeration") %>%
filter(DiffName) %>%
mutate(Reason = "City")
#Ten largest cities outside Brusels
popdata%>%
filter(population > 34000) %>%
filter(DiffName) %>%
filter(Region != "Brussels agglomeration") %>%
arrange(desc(population)) %>%
slice(1:10) %>%
select(-REFNIS) %>%
knitr::kable()| TownNL | TownFR | DiffName | population | Region |
|---|---|---|---|---|
| Antwerpen | Anvers | TRUE | 520504 | Flanders |
| Gent | Gand | TRUE | 259083 | Flanders |
| Luik | Liège | TRUE | 197885 | Wallonia |
| Brugge | Bruges | TRUE | 118187 | Flanders |
| Namen | Namur | TRUE | 110628 | Wallonia |
| Leuven | Louvain | TRUE | 100291 | Flanders |
| Bergen | Mons | TRUE | 95220 | Wallonia |
| Mechelen | Malines | TRUE | 85665 | Flanders |
| Aalst | Alost | TRUE | 84859 | Flanders |
| Sint-Niklaas | Saint-Nicolas | TRUE | 76028 | Flanders |
Reason 3: German speaking region (and towns with German language facilities)
After World War I, the peace treaty of Versailles listed the annexation of 9 German towns into Belgium as war compensation. They make up our third language region as German is still their main language today.
Given that German and Dutch are both German langauges and have a lot of similarities it would make sense that the Flemish would refer to the German town names, while the French have changed some of them.
#Listing the German communes and the two additional towns with german facilities
germanspeaking <- c("Eupen", "Kelmis", "Lontzen", "Raeren", "Amel", "Büllingen",
"Burg-Reuland", "Bütgenbach", "Sankt Vith", "Malmedy", "Weismes")
#Proportion of Cities with different names
popdata %>%
filter(TownNL %in% germanspeaking) %>%
summarise(NTowns=n(), N_SameName=n()-sum(DiffName), N_DiffName=sum(DiffName),
Prop_SameName =1-round(mean(DiffName),2), Prop_DiffName=round(mean(DiffName),2))## # A tibble: 1 x 5
## NTowns N_SameName N_DiffName Prop_SameName Prop_DiffName
## <int> <int> <int> <dbl> <dbl>
## 1 11 5 6 0.450 0.550#Adding a reason column
reason_german <- popdata %>%
filter(TownNL %in% germanspeaking) %>%
filter(DiffName) %>%
mutate(Reason = "German region")
#German towns with two official names
popdata %>%
filter(TownNL %in% germanspeaking) %>%
filter(DiffName==TRUE) %>%
select(-REFNIS) %>%
knitr::kable(align="c")| TownNL | TownFR | DiffName | population | Region |
|---|---|---|---|---|
| Kelmis | La Calamine | TRUE | 10964 | Wallonia |
| Sankt Vith | Saint-Vith | TRUE | 9661 | Wallonia |
| Weismes | Waimes | TRUE | 7493 | Wallonia |
| Bütgenbach | Butgenbach | TRUE | 5583 | Wallonia |
| Amel | Amblève | TRUE | 5523 | Wallonia |
| Büllingen | Bullange | TRUE | 5489 | Wallonia |
Reason 4: Towns in Flanders or Wallonia with official language facilities
Always a topic for debate in Belgium: the towns with official language facilities. These are towns that belong to one region but they have some degree of bilingual facilities (it’s complicated!).
#Listing all towns with language facilities
faciliteiten <- c("Bever", "Drogenbos", "Herstappe", "Kraainem", "Linkebeek",
"Mesen", "Ronse", "Sint-Genesius-Rode", "Spiere-Helkijn",
"Voeren", "Wemmel", "Wezembeek-Oppem", "Edingen",
"Komen-Waasten", "Moeskroen", "Vloesberg")
#Proportion of Cities with different names
popdata %>%
filter(TownNL %in% faciliteiten) %>%
summarise(NTowns=n(), N_SameName=n()-sum(DiffName), N_DiffName=sum(DiffName),
Prop_SameName =1-round(mean(DiffName),2), Prop_DiffName=round(mean(DiffName),2))## # A tibble: 1 x 5
## NTowns N_SameName N_DiffName Prop_SameName Prop_DiffName
## <int> <int> <int> <dbl> <dbl>
## 1 16 6 10 0.380 0.620#Adding a reason column
reason_facilities <- popdata %>%
filter(TownNL %in% faciliteiten) %>%
filter(DiffName) %>%
anti_join(reason_city) %>%
mutate(Reason = "Language facilities")
#Which towns have different names?
popdata %>%
filter(TownNL %in% faciliteiten) %>%
filter(DiffName==TRUE) %>%
select(-REFNIS) %>%
knitr::kable(align="c")| TownNL | TownFR | DiffName | population | Region |
|---|---|---|---|---|
| Moeskroen | Mouscron | TRUE | 57773 | Wallonia |
| Ronse | Renaix | TRUE | 26092 | Flanders |
| Sint-Genesius-Rode | Rhode-Saint-Genèse | TRUE | 18231 | Flanders |
| Komen-Waasten | Comines-Warneton | TRUE | 18102 | Wallonia |
| Edingen | Enghien | TRUE | 13563 | Wallonia |
| Voeren | Fourons | TRUE | 4129 | Flanders |
| Vloesberg | Flobecq | TRUE | 3426 | Wallonia |
| Bever | Biévène | TRUE | 2160 | Flanders |
| Spiere-Helkijn | Espierres-Helchin | TRUE | 2142 | Flanders |
| Mesen | Messines | TRUE | 1049 | Flanders |
The language border is obviously another factor. Throughout history, many of these towns have changed region, so they inherited more than one name.
Finally, I wanted to make an “other reason” category, and bind all the reasons to my main data. Given the large size of this post already, I did all of this in the background.
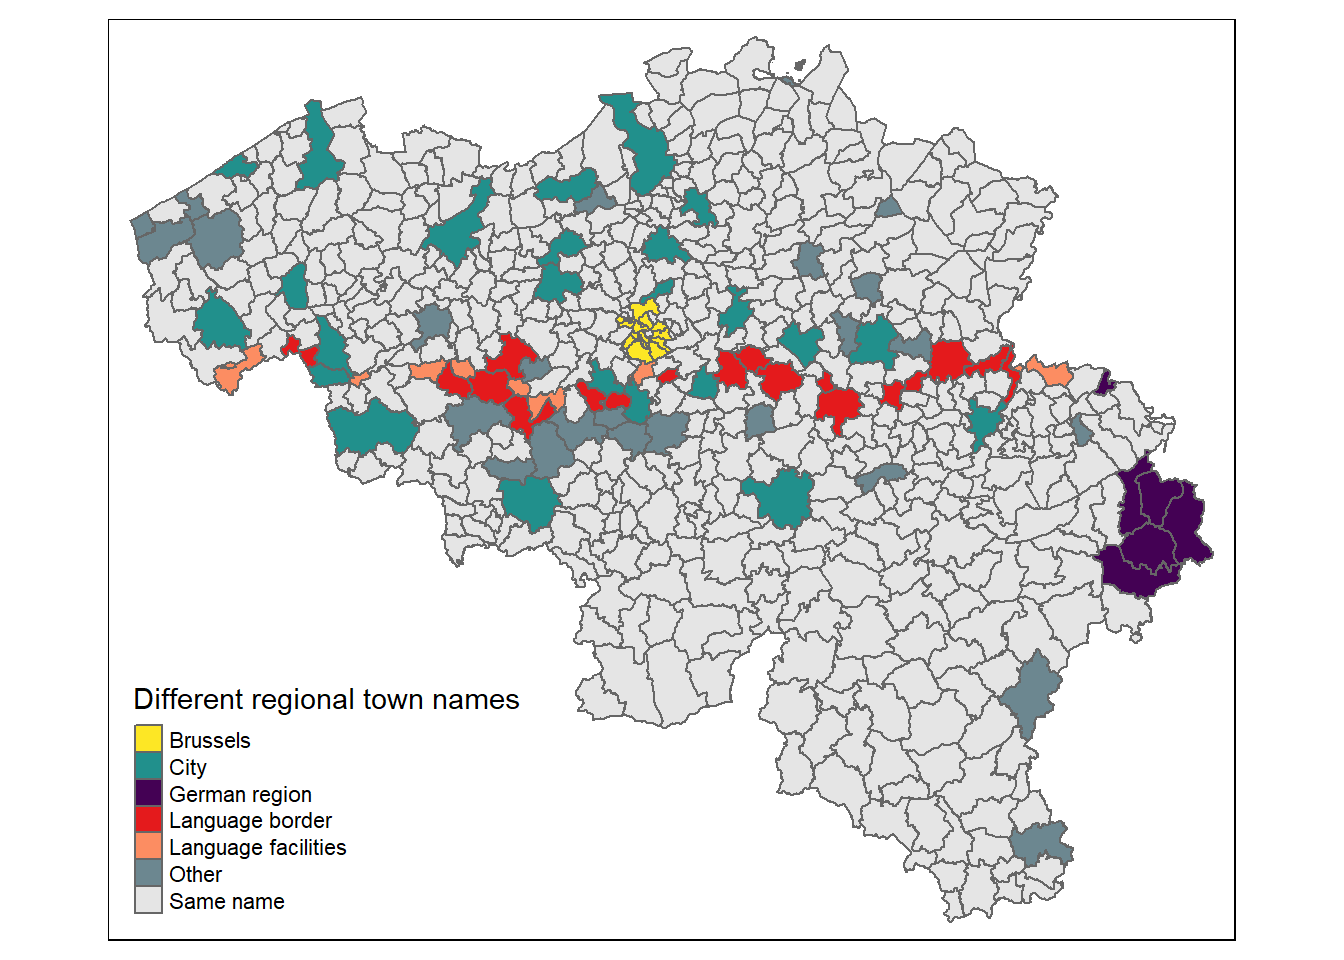
A quick reason map:
The Brussels and German region are pretty obvious dots in the map, and equally obvious is our language border. Large cities are scattered across the whole of Belgium and many of the unidentied scattered dots also represent smaller cities (like Aarlen/Arlon or Temse/Tamise).
There is one other cluster of towns south west of Brussels starting from the language border but heading to the French border. That area used to be part of the medieval County of Flanders, where both Walloon and French towns often still carry a Flemish town name. Some of them got modernized but it seems quite a few kept their original name as well.
Making a final interactive map
I wanted to bring it all together in one final interactive map. Go ahead and click away…